http://www.superiorgroupofcompanies.com
Superior Group of Companies, Inc. Company Intro
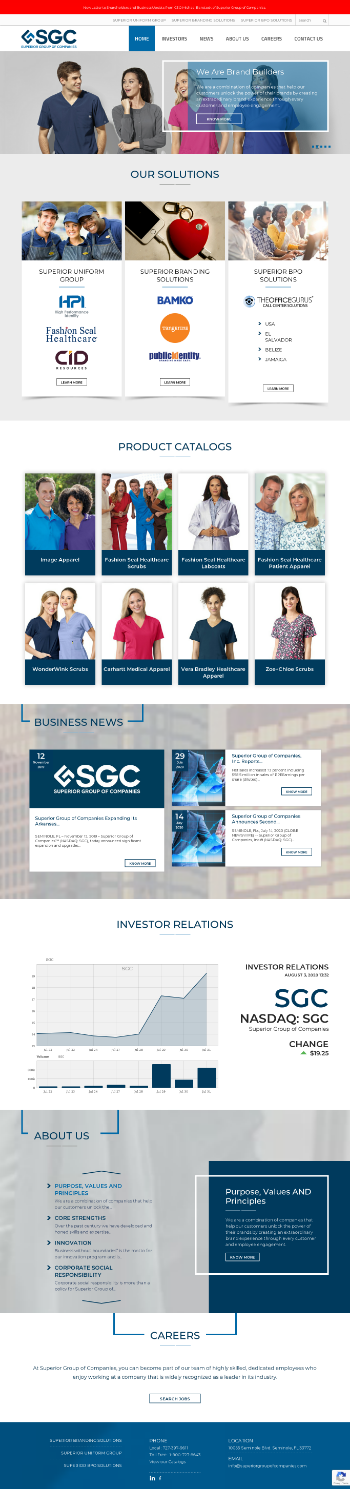
We are a combination of companies that help our customers unlock the power of their brands by creating an extraordinary brand experience.
Industry
Consumer Cyclical
Superior Group of Companies, Inc. Headquaters
10055 Seminole Boulevard
Seminole,33772
United States
Superior Group of Companies, Inc. Share price
17 May 2023 13:52 GMT
$8.78
0.18 (2.09 %)
Superior Group of Companies, Inc. Market cap
$143.04 M
WMC RANKING
2024
Superior Group of Companies, Inc. # 13
Apparel ManufacturingLatest Superior Group of Companies, Inc. News
 12 Feb 2024
Superior Group announces $0.14 quarterly dividend
ST. PETERSBURG - Superior Group of Companies, Inc. (NASDAQ:SGC), a diversified business providing healthcare apparel, branded products, and contact center...
 12 Feb 2024
Superior Group announces $0.14 quarterly dividend By Investing.com
ST. PETERSBURG - Superior Group of Companies, Inc. (NASDAQ:SGC), a diversified business providing healthcare apparel, branded products, and contact center...
 13 Feb 2024
MoneyTalks: Jarden tips 29 Metals recovery; Metcash lift
Jarden Australia has given an Overweight rating to copper producer 29 Metals (ASX:29M), despite saying the company's CY24 cash outflow is on track to wipe...
WMC Market Score
WMC Market to Revenue Score
Superior Group of Companies, Inc. Market Financials
Revenue, Expenses, Profit
| Company | Currency | Revenue | Expense | Profit | Market Cap | WMC Sector Score |
| Superior Group of Companies, Inc. | USD | $573,299 | $145,236 | $48,137 | $1,430M | 13 |
| PVH Corp. | USD | $7,867,900 | $4,082,500 | $60,600 | $1,000,840B | 1 |
| Hanesbrands Inc. | USD | $6,969,309 | $1,884,107 | $-330,967 | $13,530B | 2 |
| Levi Strauss & Co. | USD | $5,030,514 | $2,272,881 | $290,942 | $52,600B | 3 |
| Under Armour, Inc. | USD | $4,801,622 | $2,133,871 | $118,256 | $31,190B | 4 |
Market Analytics
Company Search vs Top 4 Industry Competitors
Total Superior Group of Companies, Inc. Social Followers vs Top 4 Industry Competitors
Superior Group of Companies, Inc. Post vs Top 4 Industry Competitors
Superior Group of Companies, Inc. Digital Footprint By Size vs Top 4 Industry Competitors
Superior Group of Companies, Inc. Digital Footprint By Change Rate vs Top 4 Industry Competitors
Superior Group of Companies, Inc. WMC Market Score Calculations
| Details | Revenue | Total Social Followers | Total Social Posts | Search Volume | Digital Footprint Size | Digital change (New Pages) | WMC Market Score |
| Superior Group of Companies, Inc. | 7.29 | 0.00 | 0.00 | 0 | 0 | 0 | 0.00 |
| PVH Corp. | 100 | 1.51 | 15.32 | 0 | 0 | 0 | 11.11 |
| Hanesbrands Inc. | 88.58 | 13.73 | 31.43 | 0 | 0 | 0 | 29.82 |
| Levi Strauss & Co. | 63.94 | 0.61 | 100 | 0 | 0 | 0 | 66.42 |
| Under Armour, Inc. | 61.03 | 100 | 51.47 | 0 | 0 | 0 | 100 |
Book a demo
Book a free one-on-one demo with one of our team and see exactly how the WMC business intelligence platform can help you protect and grow revenue.
* required fields
You'll learn how to:
- 1. Automatically monitor your entire digital landscape including competitors
- 2. View all new industry activity in real time
- 3. Monitor your position in your industry
- 4. Enrich your reports and strategy
- 5. Empower your teams with knowledge


