http://www.roireit.net
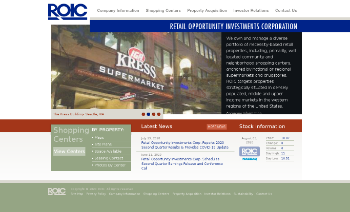
Retail Opportunity Investments Corp. Company Intro
Industry
Real Estate
Retail Opportunity Investments Corp. Headquaters
11250 El Camino Real
San Diego,92130
United States
Retail Opportunity Investments Corp. Share price
17 May 2023 13:49 GMT
$12.51
0.45 (3.73 %)
Retail Opportunity Investments Corp. Market cap
$1.524 B
WMC RANKING
2024
Retail Opportunity Investments Corp. # 20
REIT—RetailLatest Retail Opportunity Investments Corp. News
 12 Feb 2024
Nomura Holdings, Inc. (NYSE:NMR) Shares Acquired by Sequoia Financial Advisors LLC
Read Nomura Holdings, Inc. (NYSE:NMR) Shares Acquired by Sequoia Financial Advisors LLC at Defense World.
 12 Feb 2024
Sequoia Financial Advisors LLC Invests $136000 in The Hain Celestial Group, Inc. (NASDAQ:HAIN)
Read Sequoia Financial Advisors LLC Invests $136000 in The Hain Celestial Group, Inc. (NASDAQ:HAIN) at Defense World.
 12 Feb 2024
Sequoia Financial Advisors LLC Boosts Position in Retail Opportunity Investments Corp. (NASDAQ:ROIC)
Read Sequoia Financial Advisors LLC Boosts Position in Retail Opportunity Investments Corp. (NASDAQ:ROIC) at Defense World.
WMC Market Score
WMC Market to Revenue Score
Retail Opportunity Investments Corp. Market Financials
Revenue, Expenses, Profit
| Company | Currency | Revenue | Expense | Profit | Market Cap | WMC Sector Score |
| Retail Opportunity Investments Corp. | USD | $278,429 | $113,679 | $27,350 | $15,240B | 20 |
| Simon Property Group, Inc. | USD | $4,494,094 | $1,709,000 | $1,117,482 | $389,760B | 1 |
| Realty Income Corporation | USD | $1,680,088 | $763,485 | $344,599 | $406,880B | 2 |
| Brookfield Property REIT Inc. | USD | $1,563,968 | $530,033 | $432,880 | N/A | 3 |
| Kimco Realty Corporation | USD | $1,050,457 | $391,112 | $1,018,966 | $111,950B | 4 |
Market Analytics
Company Search vs Top 4 Industry Competitors
Total Retail Opportunity Investments Corp. Social Followers vs Top 4 Industry Competitors
Retail Opportunity Investments Corp. Post vs Top 4 Industry Competitors
Retail Opportunity Investments Corp. Digital Footprint By Size vs Top 4 Industry Competitors
Retail Opportunity Investments Corp. Digital Footprint By Change Rate vs Top 4 Industry Competitors
Retail Opportunity Investments Corp. WMC Market Score Calculations
| Details | Revenue | Total Social Followers | Total Social Posts | Search Volume | Digital Footprint Size | Digital change (New Pages) | WMC Market Score |
| Retail Opportunity Investments Corp. | 6.20 | 0 | 0 | 0 | 0 | 0 | 0 |
| Simon Property Group, Inc. | 100 | 0.65 | 10.34 | 0 | 0 | 0 | 5.50 |
| Realty Income Corporation | 37.38 | 100 | 100 | 0 | 0 | 0 | 100 |
| Brookfield Property REIT Inc. | 34.80 | 0.05 | 3.30 | 0 | 0 | 0 | 1.68 |
| Kimco Realty Corporation | 23.37 | 0.10 | 7.84 | 0 | 0 | 0 | 3.97 |
Book a demo
Book a free one-on-one demo with one of our team and see exactly how the WMC business intelligence platform can help you protect and grow revenue.
* required fields
You'll learn how to:
- 1. Automatically monitor your entire digital landscape including competitors
- 2. View all new industry activity in real time
- 3. Monitor your position in your industry
- 4. Enrich your reports and strategy
- 5. Empower your teams with knowledge


