http://www.msci.com
MSCI Inc. Company Intro
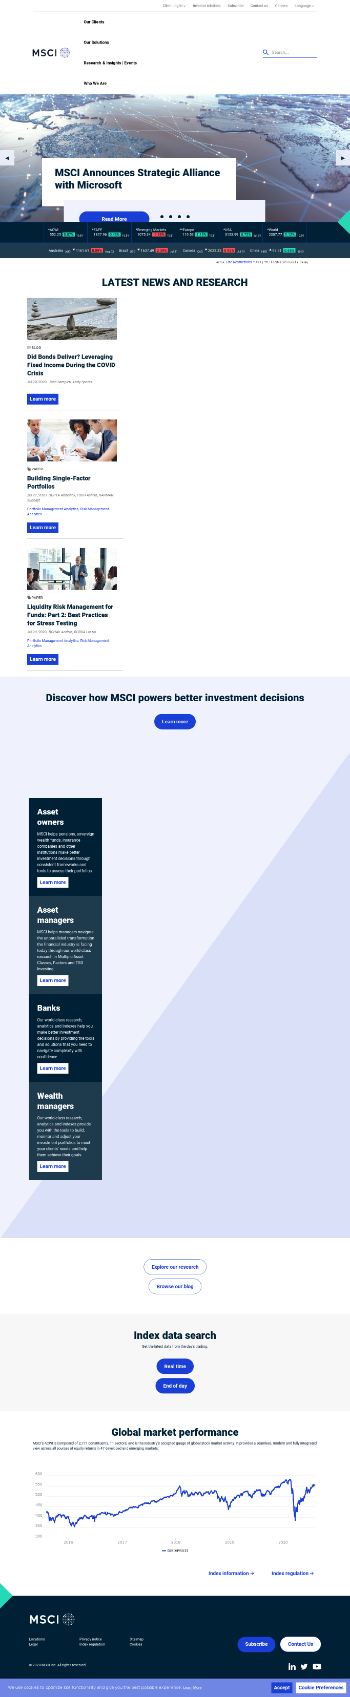
MSCI strives to bring greater transparency to financial markets and enable the investment community to make better decisions for a better world.
Industry
Financial Services
MSCI Inc. Headquaters
7 World Trade Center
New York,10007
United States
MSCI Inc. Share price
17 May 2023 13:33 GMT
$460.55
3.57 (0.78 %)
MSCI Inc. Market cap
$37.073 B
WMC RANKING
2024
MSCI Inc. # 7
Financial Data & Stock ExchangesLatest MSCI Inc. News
 13 Feb 2024
India's weightage climbs to record high on MSCI Global Standard index
By Bharath Rajeswaran. BENGALURU, Feb 13 (Reuters) -Index provider MSCI raised India's weightage in its Global Standard (Emerging Markets) index to a...
 13 Feb 2024
Asia Stocks Gain, Led by Japan, Korea; US CPI Eyed: Markets Wrap
(Bloomberg) -- Shares climbed in Asia following advances in Japanese and South Korean stocks as trading resumed after a holiday while US equity futures...
 13 Feb 2024
GMR Airports Shares Rise After MSCI Upgrades It To Mid Cap In EM Index
Shares of GMR Airports Infrastructure Ltd. rose on Tuesday after MSCI Inc. upgraded it to mid-cap from small-cap in the Emerging Markets Index.
WMC Market Score
WMC Market to Revenue Score
MSCI Inc. Market Financials
Revenue, Expenses, Profit
| Company | Currency | Revenue | Expense | Profit | Market Cap | WMC Sector Score |
| MSCI Inc. | USD | $1,757,033 | $522,903 | $650,516 | $370,730B | 7 |
| Intercontinental Exchange, Inc. | USD | $8,558,000 | $1,856,000 | $2,085,000 | $610,260B | 1 |
| Nasdaq, Inc. | USD | $5,926,000 | $782,000 | $1,028,000 | $268,160B | 2 |
| MOODYS CORP | USD | $5,681,000 | $1,451,000 | $2,026,000 | $570,830B | 3 |
| Cme Grp. Inc. | USD | $4,614,800 | $1,338,200 | $1,913,400 | $651,770B | 4 |
Market Analytics
Company Search vs Top 4 Industry Competitors
Total MSCI Inc. Social Followers vs Top 4 Industry Competitors
MSCI Inc. Post vs Top 4 Industry Competitors
MSCI Inc. Digital Footprint By Size vs Top 4 Industry Competitors
MSCI Inc. Digital Footprint By Change Rate vs Top 4 Industry Competitors
MSCI Inc. WMC Market Score Calculations
| Details | Revenue | Total Social Followers | Total Social Posts | Search Volume | Digital Footprint Size | Digital change (New Pages) | WMC Market Score |
| MSCI Inc. | 20.53 | 7.65 | 4.21 | 51 | 0 | 0 | 29.35 |
| Intercontinental Exchange, Inc. | 100 | 100 | 100 | 14 | 0 | 0 | 100 |
| Nasdaq, Inc. | 69.25 | 85.87 | 28.09 | 100 | 0 | 0 | 99.80 |
| MOODYS CORP | 66.38 | 7.56 | 0.08 | 0 | 0 | 0 | 3.56 |
| Cme Grp. Inc. | 53.92 | 32.86 | 8.27 | 0 | 0 | 0 | 19.18 |
Book a demo
Book a free one-on-one demo with one of our team and see exactly how the WMC business intelligence platform can help you protect and grow revenue.
* required fields
You'll learn how to:
- 1. Automatically monitor your entire digital landscape including competitors
- 2. View all new industry activity in real time
- 3. Monitor your position in your industry
- 4. Enrich your reports and strategy
- 5. Empower your teams with knowledge


