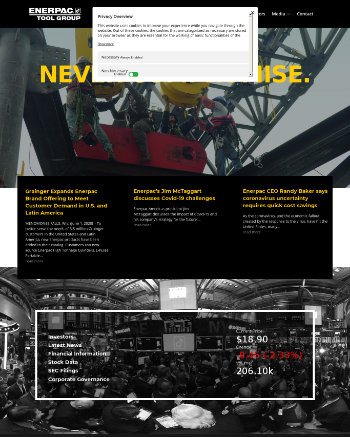
http://www.enerpactoolgroup.com
Enerpac Tool Group Corp. Company Intro
© 2020 Enerpac Tool Group, all rights reserved. |
Industry
Industrials
Enerpac Tool Group Corp. Headquaters
N86 W12500 Westbrook Crossing
Menomonee Falls,53051
United States
Enerpac Tool Group Corp. Share price
17 May 2023 13:08 GMT
$24.32
-0.15 (-0.61 %)
Enerpac Tool Group Corp. Market cap
$1.399 B
WMC RANKING
2024
Enerpac Tool Group Corp. # 69
Specialty Industrial MachineryLatest Enerpac Tool Group Corp. News
 09 Feb 2024
Long Term Trading Analysis for (EPAC)
Trading Report for Enerpac Tool Group Corp. EPAC With Buy and Sell Signals.
 09 Feb 2024
Enerpac Tool Group announces CFO transition - Investing.com ZA
MILWAUKEE - Enerpac Tool Group Corp. (NYSE: EPAC ), a global provider of industrial tools and solutions, today announced the upcoming departure of Executive...
 09 Feb 2024
Enerpac Tool Group (NYSE:EPAC) Shares Gap Down to $31.38
Enerpac Tool Group Corp. (NYSE:EPAC - Get Free Report)'s stock price gapped down before the market opened on Friday . The stock had previously closed at...
WMC Market Score
WMC Market to Revenue Score
Enerpac Tool Group Corp. Market Financials
Revenue, Expenses, Profit
| Company | Currency | Revenue | Expense | Profit | Market Cap | WMC Sector Score |
| Enerpac Tool Group Corp. | USD | $494,586 | $176,221 | $34,250 | $13,990B | 69 |
| General Electric Company | USD | $77,248,010 | $17,170,000 | $-3,800,000 | $1,102,600B | 1 |
| 3M Company | USD | $32,960,000 | $8,834,000 | $5,700,000 | $542,050B | 2 |
| Honeywell International Inc. | USD | $32,628,000 | $4,770,000 | $4,625,000 | $1,300,010B | 3 |
| Cummins Inc. | USD | $20,892,000 | $3,100,000 | $1,881,000 | $309,670B | 4 |
Market Analytics
Company Search vs Top 4 Industry Competitors
Total Enerpac Tool Group Corp. Social Followers vs Top 4 Industry Competitors
Enerpac Tool Group Corp. Post vs Top 4 Industry Competitors
Enerpac Tool Group Corp. Digital Footprint By Size vs Top 4 Industry Competitors
Enerpac Tool Group Corp. Digital Footprint By Change Rate vs Top 4 Industry Competitors
Enerpac Tool Group Corp. WMC Market Score Calculations
| Details | Revenue | Total Social Followers | Total Social Posts | Search Volume | Digital Footprint Size | Digital change (New Pages) | WMC Market Score |
| Enerpac Tool Group Corp. | 0.64 | 0 | 0 | 0 | 0 | 0 | 0 |
| General Electric Company | 100 | 100 | 100 | 0 | 0 | 0 | 100 |
| 3M Company | 42.67 | 82.49 | 36.98 | 0 | 0 | 0 | 59.73 |
| Honeywell International Inc. | 42.24 | 27.92 | 3.34 | 0 | 0 | 0 | 15.63 |
| Cummins Inc. | 27.05 | 7.96 | 31.49 | 0 | 0 | 0 | 19.73 |
Book a demo
Book a free one-on-one demo with one of our team and see exactly how the WMC business intelligence platform can help you protect and grow revenue.
* required fields
You'll learn how to:
- 1. Automatically monitor your entire digital landscape including competitors
- 2. View all new industry activity in real time
- 3. Monitor your position in your industry
- 4. Enrich your reports and strategy
- 5. Empower your teams with knowledge


