http://ampcopgh.com
Ampco-Pittsburgh Corporation Company Intro
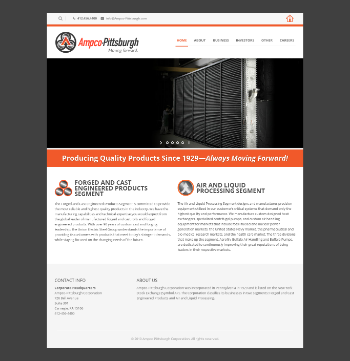
The Forged and Cast Engineered Products Segment is committed to provide the most reliable and highest quality products in the industry. We have the manufacturing capabilities and technical expertise you would expect from the global leader of manufactured forged and cast rolls and forged engineered products. With over 90 years of custom cast and forging leadership, the Union Electric Steel Group understands the importance of providing its customers with products that meet today’s stringent demands, while staying focused on the changing needs of the future.
Industry
Industrials
Ampco-Pittsburgh Corporation Headquaters
726 Bell Avenue
Carnegie,15106
United States
Ampco-Pittsburgh Corporation Share price
17 May 2023 12:46 GMT
$2.7200
-0.01 (-0.37 %)
Ampco-Pittsburgh Corporation Market cap
$52.553 M
WMC RANKING
2024
Ampco-Pittsburgh Corporation # 10
Metal FabricationLatest Ampco-Pittsburgh Corporation News
WMC Market Score
WMC Market to Revenue Score
Ampco-Pittsburgh Corporation Market Financials
Revenue, Expenses, Profit
| Company | Currency | Revenue | Expense | Profit | Market Cap | WMC Sector Score |
| Ampco-Pittsburgh Corporation | USD | $324,281 | $63,889 | $3,995 | $526M | 10 |
| Ryerson Holding Corporation | USD | $3,603,600 | $570,400 | $-56,900 | $12,820B | 1 |
| Valmont Industries, Inc. | USD | $2,996,041 | $530,912 | $152,778 | $60,340B | 2 |
| Allegheny Technologies Incorporated | USD | $2,719,100 | $192,300 | $-1,601,600 | $44,950B | 3 |
| Mueller Industries, Inc. | USD | $2,613,272 | $212,179 | $170,185 | $42,890B | 4 |
Market Analytics
Company Search vs Top 4 Industry Competitors
Total Ampco-Pittsburgh Corporation Social Followers vs Top 4 Industry Competitors
Ampco-Pittsburgh Corporation Post vs Top 4 Industry Competitors
Ampco-Pittsburgh Corporation Digital Footprint By Size vs Top 4 Industry Competitors
Ampco-Pittsburgh Corporation Digital Footprint By Change Rate vs Top 4 Industry Competitors
Ampco-Pittsburgh Corporation WMC Market Score Calculations
| Details | Revenue | Total Social Followers | Total Social Posts | Search Volume | Digital Footprint Size | Digital change (New Pages) | WMC Market Score |
| Ampco-Pittsburgh Corporation | 9.00 | 0 | 0 | 0 | 0 | 0 | 0 |
| Ryerson Holding Corporation | 100 | 70.83 | 100 | 0 | 0 | 0 | 95.61 |
| Valmont Industries, Inc. | 83.14 | 38.99 | 15.79 | 0 | 0 | 0 | 30.66 |
| Allegheny Technologies Incorporated | 75.46 | 100 | 78.68 | 0 | 0 | 0 | 100 |
| Mueller Industries, Inc. | 72.52 | 0 | 0 | 0 | 0 | 0 | 0 |
Book a demo
Book a free one-on-one demo with one of our team and see exactly how the WMC business intelligence platform can help you protect and grow revenue.
* required fields
You'll learn how to:
- 1. Automatically monitor your entire digital landscape including competitors
- 2. View all new industry activity in real time
- 3. Monitor your position in your industry
- 4. Enrich your reports and strategy
- 5. Empower your teams with knowledge


